Uncategorised
Why should global CO2 levels be reported by the media and journalists? Dr. Richard Kool and Michael McGee, M.A., made this eight-minute presentation to answer to this question.
As you listen, consider using a CO2 tracker for web, print, or televisions to show your audiences the world's leading environmental signal in real time. Also, feel free to say Aloha to Rick or Mike and while you're at it, please include the suggestions, requests and questions which are on your mind.
Speaker
- Dr. Carl Sagan
Summary
- Concise, 15-minute explanation of greenhouse effect, how scientists understand the greenhouse effect and its causes and effects with certainty, areas where additional research is recommended, and the nature of the greenhouse effect challenge and solutions to act now, not later.
Date
- December 10, 1985
Video source
Event
- Hearing before the Subcommittee on Toxic Substances and Environmental Oversight of the Committee on Environment and Public Works, United States Senate, Ninety-Ninth Congress, First Session, December 10, 1985.

News, weather and CO2 on CHEX News at 6
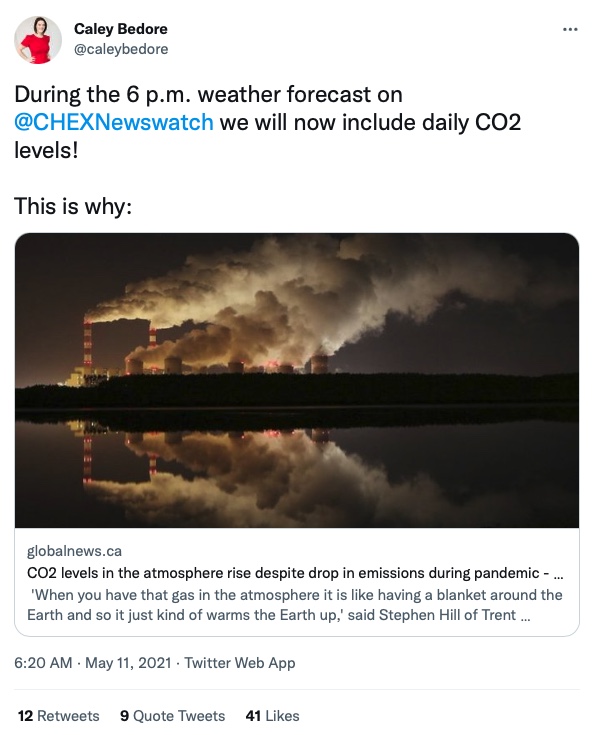
Since May 10, 2021, CHEX News at 6 on has been reporting CO2 levels on Canada's Global Television Network to viewers in the Peterborough region, east of Toronto. CO2 updates began when trusted weather specialist, Caley Bedore, added daily CO2 averages to her televised reporting.
Sourcing daily CO2 numbers
The CHEX weather specialist at CHEX Global News sources global CO2 numbers from the CO2.Earth daily CO2 page to produce a simple almanac graphic which television viewers see on their screen. The CO2 numbers on the CO2.Earth site originate from the daily CO2 average which the National Oceanic and Atmospheric Administration, or NOAA, reported earlier in the day. NOAA continually measures CO2 levels in the well-mixed air at the Mauna Loa Observatory in Hawaii, 3400 metres above sea level.
Sample weather & CO2 broadcasts
Video Sample
Video: Sample of full weather report on Jan. 11, 2022, including CO2 & temperature almanac (CO2 for Jan. 10, 2022)
TV broadcast: News at 6 with weather specialist Caley Bedore on Global Peterborough (CHEX)
Sample TV Screenshot
TV screen from CHEX Global Peterborough News at 6 broadcast on August 19, 2021 (CO2 for Aug. 18)
CHEX Global News Video via Show.Earth - 2021 Television sample (10 seconds - CO2 level with temperature records) on Thursday August 19 with daily CO2 (414.97 ppm) for Wed. Aug. 18
CHEX Global News Video via Show.Earth - 2022 Television sample (3 minutes - full weather & CO2 report) on Tues. Jan. 11 with daily CO2 (417.91 ppm) for Mon. Jan. 10
The start of televised CO2 levels
More about the start of CO2 reports
CHEX Global News @CaleyBedore on Twitter: May 10 2021 Television sample (38 seconds): First daily CO2 report (417.79 ppm on May 9) on the station and network
CHEX Global News TV feature broadcast (3 min.): May 11 2021 CO2 levels in atmosphere rise dispite emissions drop during pandemic
CHEX Global News Web article: May 11 2021 CO2 levels in atmosphere rise dispite emissions drop during pandemic
|
ICYMI: Here is a clip from Monday's forecast on how we will be presenting CO2 levels: (Note: I have been working from home) https://t.co/8yR0sGbXEc pic.twitter.com/WSCSkzlDex — Caley Bedore (@caleybedore) May 12, 2021 |
Broadcaster links
CHEX Global News Peterborough
Twitter @caleybedore and @CHEXNewswatch
More CO2 broadcasting
Show.Earth CO2 for radio listeners

The world's first radio report of CO2 levels every weekday
Any weekday morning at about 6:45 am, tune into CBC Radio One's On The Island with host Gregor Craigie to hear a morning market update with a stock-take for the lates daily level of CO2 in the Earth's atmosphere.
Since September 2019, Craigie has been reporting carbon dioxide (CO2) levels to his listeners on Vancouver Island and the Sunshine Coast in British Columbia, Canada. If he's on vacation and his fill-in host forgets the CO2--which has happened--listeners call and email until regular CO2 broadcasting resumes.
As far as we know, Craigie's CBC morning show is the first in the world to report atmospheric CO2 levels on the radio on a regular basis. When he reports the latest numbers for the stock market and commodity prices for lumber, oil and natural gas, he reads two atmospheric CO2 numbers: one for the day before and one from a year ago.
As an aside, we view this reporting of environmental and economic signals togethers as a practice which is appropriate and needed for our economic systems to become sustainable.
Radio host sources daily CO2 numbers from CO2.Earth
The latest global CO2 numbers which Gregor Craigie reports are taken from the CO2.Earth daily CO2 page. Those CO2 numbers are sourced from readings reported by the National Oceanic and Atmospheric Administration, or NOAA, which continually measures CO2 levels in the clean, well-mixed air at the Mauna Loa Observatory in Hawaii.
Sample of a CO2 report on CBC Radio
Morning market report with CO2 update
October 15, 2019: Report by Gregor Craigie on CBC Radio One
This recording can also be listened to on SoundCloud (CO2.Earth).
CO2 update only (10 seconds)
Oct 15, 2019: Snippet of above report by Gregor Craigie on CBC Radio One, Vancouver Island
Related interviews and articles
Dr. Francis Zwiers on rising CO2 levels during the pandemic
Dec 18 2020: Interview by Gregor Craigie on CBC Radio One, Vancouver Island
> Download MP3: If pollution is dropping during the pandemic, why is CO2 rising? (9 mb via Show.Earth)
Dr. Richard Kool on the relationship of the stock market and CO2 levels
Sep 24 2019: Interview by Gregor Craigie on CBC Radio One, Vancouver Island
CBC recording > The relationship between the stock market and CO2 emission levels (content removed)
Include CO2 levels in stock market reports, BC professor says
Sep 24, 2019: Article by Dr. Richard Kool
CBC.ca > Include CO2 emission levels in stock market reports, says B.C. professor
It's worth a daily reminder: When markets are up, the environment is down
May 10, 2019: Article by Dr. Richard Kool
National Post > It’s worth a daily reminder: When markets are up, the environment is down.
Public comment
Oct 16 2019: Twitter @billmckibben | Tweet by Bill McKibben
Listen to this: Every morning during the stock mkt report the CBC Vancouver radio broadcast has started giving the global co2 number for the day, and how much it's increased in the past yearhttps://t.co/SJEPOC3K09
— Bill McKibben (@billmckibben) October 17, 2019
CBC On The Island
CBC Listen On The Island with Gregor Craigie
CBC Programs On The Island
CBC Media Centre About Gregor Craigie
Twitter @gregorcraigie and @CBContheisland
Other CO2 broadcasts
Show.Earth 2021 CO2 makes the list for 'number of the year' on BBC Radio programme

Broadcast on BBC Radio 4 marks 420 ppm CO2 as a number of the year in 2021
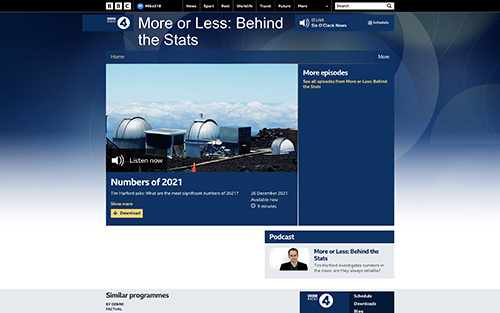
Tim Harford is a numbers guy. It's fitting that he is a host of More or Less: Behind the Stats, the BBC Radio 4 programme and BBC World Service broadcast which explains the numbers that matter to BBC audiences in their everyday lives.
On Boxing Day 2021, Harford bent the ears of his listeners toward a simple, reflective question: What were the most signficant numbers of 2021? Aided by three knowledgeable guests, the result is the 9-minute podcast episode, "Numbers of 2021."
His third guest is Heleen De Coninck, a professor at Eindhoven University of Technology in the Netherlands,and a lead author on several reports by the Intergovernmental Panel on Climate Change. At the six-minute mark, Harford introduces De Coninck as a person who has closely studied the atmospheric CO2 numbers from the Mauna Loa Observatory in Hawaii. With that, she adds the new CO2 record to the short list of significant numbers in 2021:
My number of the year is 420.01. It represents the weekly average of the CO2 concentration in parts per million, and it's the first time—this year—that it actually exceeded 420.
De Coninck is referring to the 2021 record-high in the one-week average level of CO2 in the Earth's atmosphere. How signficant is this? De Coninck tells us in quantitative terms: "Four hundred twenty is an increase of 50% compared to pre-industrial CO2 concentrations." Spoiler alert! She goes further to explain how the economic slowdown of the COVID-19 global pandemic has done little to slow the rise of planet-heating CO2 levels in the atmosphere.
Below, links are provided for listening to the 9-minute broadcast, or the 3-minute discussion at the end with De Coninck. As well, links follow with resources available for tracking and broadcasting information about the global CO2 signal.
CO2 data for broadcasters
Atmospheric CO2 is a leading indicator of global changes ahead, not just in 2021, but every week, month and year for decades to come. Broadcasting additional updates will bring attention and supportive energy to the climate-stabilizing action and investment which has been lagging for decades.
The CO2 records webpage at CO2.Earth gives broadcasters and other people of the world direct access to the most recent, record-high measurement of CO2 levels in the Earth's atmosphere.
CO2.Earth and Show.Earth are continually updating the list of CO2 records as a free, ongoing service for media outlets and concerned citizens who track and distribute information about atmospheric CO2.
Broadcast links
>> Download higher-resolution screenshot
BBC Radio 4 Dec 26 2021 broadcast: webpage Numbers of 2021. Tim Harford asks: What are the most significant numbers of 2021? [BBC World Service webpage] [MP3 file]
BBC Radio 4 Programme page More or Less: Behind the Stats
BBC World Service All episodes More or Less: Behind the Stats
Other CO2 broadcasts
Show.Earth Reporting CO2 with market numbers on CBC Radio One

Drew Monkman is a retired teacher, author of three books, photographer, guide, presenter, and recorder of local nature observations. He is a passionate advocate for learning about and from the natural world and its myriad connections from the smallest microbes in our soils to the composition of the atmosphere which envelopes our vibrant, living planet.
On October 22, 2021, Drew began adding a CO2 tracker to the nature column he writes for most Friday editions of The Peterborough Examiner, a daily newspaper serving readers in Eastern Ontario, Canada. Graphics for the tracker are produced by the small team that operates the CO2.Earth and Show.Earth websites. If you would like your city or neighbourhood newspaper to add this CO2 tracker each week, let the editor know with a link to the CO2 graphic used by Drew Monkman.
On the subject of keeping CO2 levels visible, Drew shared this:
My column helps readers connect with our local and regional environment. Here in the Peterborough area, in the Kawartha's, people are noticing the effects of climate change. I photograph the birds, animals and plants that are all around us, and I write about what is happening and changing each season, year and decade.
The CO2 trackers helps people see more. They bring the global part of this picture into plainer view. Like a stock market summary, the updates for CO2 levels in the atmosphere allow my readers to quickly check the bigger trend behind our changing climate and the impacts. The CO2 trackers provide readers a regular reminder of a part of the picture that is important but not so plain to see. They are simple and uncluttered, and the information they deliver each week is very connected to the people, places and wildlife which I hope will benefit in some way from the writing and images I share in the paper and on my website.
With the links that follow, you are invited to learn more about Drew Monkman's work, The Peterborough Examiner and usage of CO2 trackers in Eastern Ontario, Canada.
Print samples from The Peterborough Examiner
Jan 7 2022 The Peterborough Examiner (pp. B10-11) A Christmas tradition: Counting birds (2 full pages)
Jan 7 2022 The Peterborough Examiner (p. B10) A Christmas tradition: Counting birds (CO2 Tracker closeup)
Nov 12 2021 The Peterborough Examiner (p. C5) A look at the annual winter finch forecast (full page)
Nov 12 2021 The Peterborough Examiner (p. C5) A look at the annual winter finch forecast (CO2 Tracker closeup)
Tracking CO2 on the Drew Monkman homepage
In addition to the newspaper column, Drew Monkman keeps visitors to the drewmonkman.com homepage current on the global level and trend for CO2 in the atmosphere. He does this by embedding the self-updating Weekly CO2 Tracker widget by Show.Earth and CO2.Earth.

General links
The Peterborough Examiner Digital homepage
drewonkman.com Our changing seasons (home page)
CO2 trackers for readers & editors
Show.Earth CO2 for newspaper readers
Show.Earth CO2 for newspaper editors
Show.Earth makes it simple for editors and managing editors to print the most current and important signal for planetary health as it changes for the readers in their newspaper market.
The graphics below introduce two CO2 Trackers which are updated weekly and free for your paper's production team to download and print. These standard graphics are ready for four-colour printing in PDF, JPEG and PSD formats.
You may need a custom design, size or specification is needed for a CO2 Tracker to work well with your brand or printing press. Or you may want know which options will work with your submission deadlines, submission procedures or publication dates. Simply email us at This email address is being protected from spambots. You need JavaScript enabled to view it. to get the information or advice you need to learn which of our products and services will work for your staff and readers.
Producers of our CO2 Trackers work hard to make it easy for busy newspaper production teams to deliver the latest CO2 updates to their subscribers and news readers. And when we provide customization, production and delivery services to newspapers, we do it free of charge.
'The Square' CO2 tracker for newspapers

'The Square' weekly CO2 tracker is kept up-to-date with in 8 standard sizes and 3 file formats with 100%K black ink on either a white or transparent background.
Choose any of the 17 print-ready files at 'The Square' CO2 Tracker for Print Media for download ![]() .
.
'The Weekly' colour CO2 tracker for print media

'The Weekly' colour CO2 tracker is print-ready in 15 sizes as a PDF produced in CMYK colour mode.
Choose any file from 'The Weekly' CO2 Tracker for Print Media for download ![]() .
.
Publication frequencies
Daily, weekly, monthly and yearly CO2 datasets are available with real-time updates for publication in print and digital media.
Table 1 below identifies available options for CO2 publication frequencies. It also offers general guidance on which CO2 datasets are appropriate for print media.
Table 1: Print-ready CO2 trackers
| CO2 Dataset | Print-Ready Production Options | Print Frequency |
| Weekly MLO CO2 | Use CO2 trackers by Show.Earth & CO2.Earth | Weekly publication in daily or weekly papers |
| Daily & Weekly MLO CO2 | Self-produced from daily and weekly CO2 datasets | Daily publication in daily papers |
| Monthly MLO CO2 | CO2 trackers by Show.Earth & CO2.Earth are available on request | Monthly publication in monthly periodicals |
| Annual MLO CO2 | CO2 trackers by Show.Earth & CO2.Earth are available on request | Yearly supplement or feature in any paper or publication |
Next, Table 2 identifies current options for the publication of CO2 trackers on media outlet websites.
Table 2: CO2 trackers & data for digital publication (RGB)
| CO2 Dataset | Web Tracker Production Options |
| Daily MLO CO2 |
Available on request:
|
| Weekly MLO CO2 |
Ready for use:
|
| Monthly MLO CO2 |
Ready for use:
|
| Annual MLO CO2 |
Request custom design:
|
Our CO2 media team offers customization, advice and technical assistance. Simply contact our CO2 media team at This email address is being protected from spambots. You need JavaScript enabled to view it..
More for newspaper editors
Show.Earth CO2 for newspaper readers
Show.Earth The Guardian's story on tracking CO2 during the climate emergency
Canada's largest weekly newspaper, The Georgia Straight in Vancouver, has been posting atmospheric CO2 levels in its web edition since April 23, 2020. Its web edition added the CO2 levels by including information which one of its columnists, Tim Louis, pulls from CO2.Earth to add to the articles he writes for The Georgia Straight and his online blog, Tim Louis On The Issues.
Tim Louis is a practicing lawyer, former city councillor, former park commissioner and municipal activist in the City of Vancouver. Tim first added daily CO2 readings to his blog articles on September 24, 2019, just ahead of the global climate strike that month. Tim sources daily CO2 readings and comparison information for his blog and column from CO2.Earth on its daily CO2 page.
Sample CO2 Reports
Apr 3 2021: The Georgia Straight Tim Louis: David Eby--a big heart and no fear when it comes to housing
- Tim Louis blog David Eby--a big heart and no fear when it comes to housing
- CO2 snippet (blog version): 416.97 ppm
Apr 23 2020: The Georgia Straight | Tim Louis: Tighter gun controls are the best tribute to Nova Scotia's victims
- Tim Louis blog | Tighter gun controls are the best tribute to Nova Scotia's victims
- CO2 snippet (digital newspaper version): 416.28 ppm
Why Tim Louis Tracks CO2 in his Column
Sep 24 2019: TimLouis.ca | Human change NOT climate change! (CO2 snippet: 408.85 ppm)
Media Outlet & Blog Links
The Georgia Straight Online edition
The Georgia Straight Recent stories by Tim Louis
Vancouver Free Press Publishing Corp (Publisher) Acquisition of Mar 2020 by Media Central Corp)
Twitter The Georgia Straight @georgiastraight
Facebook The Georgia Straight @georgiastraight
TimLouis.ca (homepage) Tim Louis On The Issues
Twitter Tim Louis @tim_louis

Each week from late 2009 until July 2010, the Nelson Daily News published a CO2 tracker. It was designed by Mike McGee, creator of CO2.Earth and Show.Earth, and published in collaboration with Michael Jessen, a climate change columnist at the newspaper. Most of the published CO2 trackers featured CO2 levels at the time for weekly or monthly periods. Some put a spotlight on emissions or observed changes in global average temperature. Every week, the content of the CO2 tracker was different.
The CO2 bulletins were sponsored by a real estate agent in the Kootenay region of British Columbia, Canada. That is, the City of Nelson and surrounding communities. They stopped when the century-old newspaper was sold to new owners and then closed in July 2010. The archive material on this page offers one illustration of how the sales department of a newspaper and local advertisers can collaborate with us at Show.Earth and CO2.Earth to keep newspaper readers informed by the Earth's most important environmental signal as it changes.
Sample CO2 Tracker in Print
Nelson Daily News Jan 11 2010 CO2 Tracker tear sheet (pdf)

About CO2 Publication at the Newspaper
Nelson Daily News Jan 26 2010 Carbon counter keeps eye on environment: Part 1 (page 1)
Nelson Daily News Jan 26 2010 Carbon counter keeps eye on environment: Part 2 (page 4)
About the Nelson Daily News
Wikipedia Nelson Daily News (1902 - 2010)
Glacier Media Group (Original Owner) Company Homepage
gregnesteroff wixsite.com Jul 31 2020 Former home of the Nelson Daily News
CO2 for Print
Show.Earth CO2 for newspaper readers
Show.Earth CO2 for newspaper editors

A climate and CO2 reporting story about and by The Guardian
The Guardian newspaper is widely recognized as a leader for its pledge and journalistic actions to keep readers informed on the climate emergency, atmospheric CO2 levels and how these issues are connected to social, economic and environmental issues of the day.
In the words of Katharine Viner in The Guardian's climate promise of October 5, 2020:
"The global climate crisis is the emergency of our times. Amid all the fear and sadness of 2020, it remains the overwhelming long-term threat to our planet and to everyone’s health and security. That is why we promise to keep reporting on it, raising the alarm and investigating the crisis and possible solutions, until we begin to see genuine systemic change."
The Guardian is not the only media outlet which is leading in the important, ongoing work to connect these important issues. But for a few reasons, the newspaper has earned its place in the spotlight. The Guardian publishes its policies, practices and goals for readers and other media organizations. It measures and reports on its progress. And it's readership and influence are international in scope.
But not everyone has been following The Guardian's reporting on climate, tracking of CO2 and disclosure of its journalism practice and progress. For those who have not, we compiled examples and links to notable articles on this one page.
Here, we introduce The Guardian's story. Rather than write about their story from outside the newspaper, you are invited to explore the chronological collection of links below to the parts of the story which The Guardian wrote as it developed.
We do not know of another collection which makes as many key articles accessible together in one place. In any case, we believe it is a story worth exploring by anyone with a serious interest in climate media reporting, climate journalism or journalism more generally.
Our comment on the "foregrounding" of CO2 levels
There is one thing to add before we let the links to The Guardian's articles tell the story we are acknowledging and introducing: Do not overlook the small but vital realization by The Guardian that it could not meet its climate reporting pledges without publishing regular measurements of CO2 levels in the Earth's atmosphere.
Excerpt from The Guardian's Climate Pledge article, Oct 25 2021:

Worldwide, newspaper readers understand the year-over-year comparisons of CO2 measurements which are taken directly from air in our planet's atmosphere. Regular reporting of atmospheric CO2 levels allow people to see the global trend in real-time without reporting delays or need for much institutional interpretation. It gives the people of the world an objective, leading signal for the direction, level and speed of global environmental changes and their resulting cascade of impacts. It grounds the public stories and discourse about climate changes, targets and actions. It helps members of the public hold national, corporate and community leaders to account for matching and overtaking the crisis at the scale and speed it is travelling.
We think The Guardian is correct to assume that climate reporting without the latest CO2 numbers is not enough to meet its pledge to deliver environmental reporting "in service of the planet." People need to get the signals and information directly from the Earth itself. Generally, media outlets have not been doing delivering the Earth's information. But The Guardian has started in the UK. CBC Radio One, CHEX Global News and The Peterborough Examiner have started in Canada. And DCTV started in Colorado, USA.
To repeat a 2019 tweet by Greta Thunberg:
"Please share this news so that all newspapers and news outlets follow the example. Now!"
Is it enough for the media to report on global environmental change and responses to the global climate emergency without regular updates of the Earth's most important signal? We think not. They are inseparable.
Sample CO2 tracking in The Guardian
The Guardian May 2021 (weather page) MLO CO2 for May 18 2019 plus 3 annual comparisons for week of May 9-15, 2021
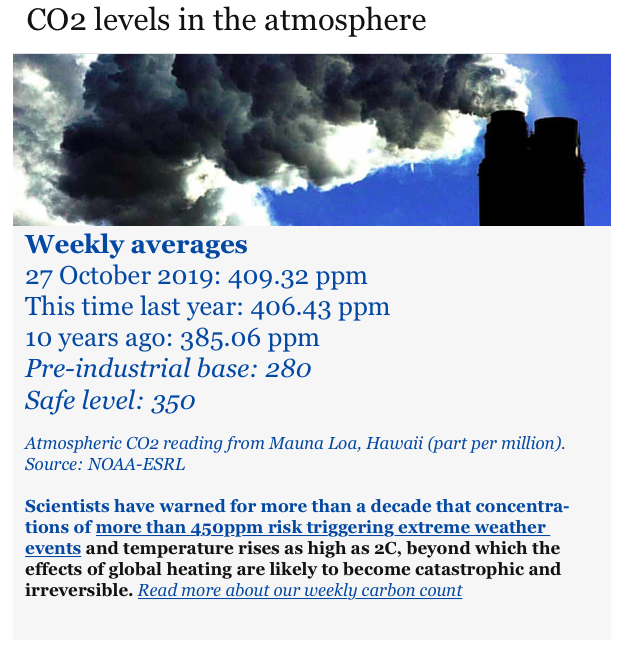
The Guardian Nov 2019 (email excerpt to digital subscribers) MLO CO2 levels for week of Oct 27-Nov 2, 2019
The Guardian May 2019 (weather page) MLO CO2 for May 20 2019 plus 3 annual comparisons for week of May 12-18, 2019

Why The Guardian publishes CO2 levels every day
The Guardian Dec 14 2018 The letter to the Guardian that sparked its CO2 reports (see comment by Daniel Scharf)
The Guardian Apr 5 2019 Why the Guardian is putting global CO2 levels in the paper every day
The Guardian May 17 2019 Why the Guardian is changing the language it uses about the environment
The Guardian Oct 15 2019 Environmental pledge 2019
The Guardian Oct 16 2019 It's a crisis not a change: 6 Guaridan language changes on climate matters
The Guardian Oct 31 2019 Guardian environment writers
The Guardian Oct 5 2020 The Guardian's climate promise: We will keep raising the alarm
The Guardian Oct 25 2021 The Guardian's climate pledge
A call to action for the media
"The Guardian...decided to include CO2 levels in their weather forecast. Please share this news so that all newspapers and news outlets follow the example. Now!"
~ Greta Thunberg (Apr 5 2019 @gretathunberg)

General links for The Guardian
The Guardian International edition online
The Guardian Environment section
The Guardian Climate change section
Facebook @theguardian
Twitter @guardian
CO2 for print
Show.Earth CO2 for newspaper readers
Show.Earth CO2 for newspaper editors
This page shows some of the newspapers which publish atmospheric CO2 updates for their readers. It also gives readers and media outlets samples of CO2 trackers which are being published in newsprint and digital editions.
The Peterborough Examiner (Canada)
CO2 tracker publication: Print edition (3 times monthly)
Show.Earth Monkman column tracks nature & CO2 in The Peterborough Examiner

The Guardian (UK)
CO2 tracker publication Print edition (daily) plus subscriber emails (weekly) which is shown below.
Show.Earth The Guardian and its story on CO2 and reporting in the climate emergency
The Guardian newspaper has been putting the latest atmospheric CO2 levels in its newsprint edition every day since 2019. And it has put itself on a course of active, responsible reporting on the global climate emergency and how CO2 and climate-related events are related. If you have a serious interest in climate media reporting, climate journalism or journalism more generally, we recommend taking a look at The Guardian and its story on CO2 and climate reporting.
Archive: Nelson Daily News (Canada)
CO2 tracker publication: Print edition (weekly)
Show.Earth Nelson Daily News: Carbon counter archive
Does your newspaper print a CO2 tracker?
Is your newspaper printing a CO2 tracker which is not acknowledged at Show.Earth? We'd love to know so we can make sure we're spreading the news. Please take a moment to tell us about your local CO2 tracker at This email address is being protected from spambots. You need JavaScript enabled to view it.. And if you're able, please send an image of the CO2 Tracker.
Do you want a CO2 tracker for your newspaper?
You may send our CO2 for newspaper editors webpage to the editor or managing editor of the newspaper you subscribe to. Also, our CO2 media team is here to collaborate and assist newspaper readers and media publishers with any CO2 tracker setup. Feel free to connect with us any time.